The Complete Guide to Workforce Analytics with Microsoft 365
A complete, practical guide to metadata-driven workforce analytics on Microsoft 365 — measuring productivity, meeting load and workload, predicting burnout ethically, and the privacy, governance and deployment foundations that make it defensible.
Workforce analytics has moved from a niche reporting exercise to a board-level concern. Hybrid working has scattered teams across time zones and calendars, meeting volumes have climbed, and HR leaders are under pressure to understand how work actually happens — without resorting to the kind of surveillance that erodes trust. The data to answer these questions already exists inside Microsoft 365. The challenge is turning it into fair, explainable, privacy-respecting insight rather than a stack of dashboards nobody trusts.
This guide is the hub for our complete library on the subject. It explains what workforce analytics is, why a metadata-driven, privacy-first approach matters now, and how each capability area works in practice. Throughout, it links to deep-dive articles on every topic, and it shows how WorkforceIntelligence365 (WI365) implements the whole discipline on Microsoft Azure.
What workforce analytics is — and what it is not
Workforce analytics is the practice of measuring how work is distributed, completed and experienced across an organisation, so leaders can improve productivity and protect wellbeing. Done well, it answers questions such as: which teams are carrying too much meeting load to get focused work done; where tasks are slipping past their due dates; and which people are showing early signs of burnout before they resign.
It is emphatically not employee monitoring. The surveillance trap — reading messages, logging keystrokes, screenshotting screens — produces resentment, legal exposure and poor data, because people change their behaviour the moment they feel watched. Modern, defensible workforce analytics works from metadata: the shape and rhythm of work (tasks, calendars, org structure), never the content of communications. If you are weighing up the difference, start with these two foundations:
- What is workforce analytics? — the discipline, its use cases and where it fits in a people-analytics function.
- Employee monitoring vs workforce analytics — the bright line between surveillance and insight, and why metadata is both more ethical and more useful.
Why a metadata-driven, privacy-first approach matters now
Three pressures have converged. First, meeting overload: focus time has been squeezed by back-to-back calls, and after-hours work has crept into evenings and weekends. Second, burnout and attrition: replacing experienced staff is expensive, and the warning signs are often visible in workload patterns weeks before someone leaves. Third, fairness and regulation: any system that influences how people are managed must be explainable, role-scoped and compliant with data-protection law. A metadata-only model addresses all three. It can quantify meeting load and overdue backlog, flag rising burnout risk, and do so on a least-privilege data footprint that stands up to a Data Protection Impact Assessment (DPIA).
The capability areas, mapped to the deep dives
The sections below walk through each capability area of workforce analytics and link the articles that cover it in detail.
Foundations
Before measuring anything, it helps to agree what you are measuring and why. The foundations articles set out the discipline and the crucial distinction from monitoring:
Measuring productivity
Productivity is the area most prone to bad metrics. Counting hours online or messages sent measures presence, not output. A credible productivity score works from completed work and respects that not all tasks are equal. The articles in this theme cover how to measure output from Microsoft 365 signals, the methodology behind a defensible composite score, and why weighting matters by department:
- Measuring employee productivity with Microsoft 365
- Productivity score methodology
- Department KPI weighting
A robust productivity model blends task completion rate, on-time delivery and a weighted task output (so big, strategic tasks are not outweighed by trivial ones), then applies a penalty for excessive meeting load. Crucially, the weights should be configurable per department — what good looks like in Sales is not what good looks like in HR or Finance.
Meetings and workload
Meeting load is one of the clearest, least controversial signals in workforce analytics, because it is measured purely from calendar metadata: start and end times, organiser, recurrence and whether an event was cancelled. From that you can derive meeting hours per week, after-hours meeting time, remaining focus hours and a meeting load index. The companion topic is workload distribution — spotting who is overloaded and who has capacity, then rebalancing before anyone burns out:
A simple, useful rule of thumb for the meeting load index: under 30% of work hours in meetings is healthy, 30-50% is moderate, and over 50% signals overload risk and almost no time for focused work.
Burnout and wellbeing
Predicting burnout from analytics is where the ethical stakes are highest, which is exactly why the model must be explainable. A black-box model that says someone is "high risk" with no reason is indefensible in an HR context. A transparent model — built from features such as overdue ratio, meeting hours, after-hours ratio, productivity trend and workload change — lets a manager see the factors driving a score and act on the cause, not the label. This theme also covers how to use that insight to reduce regretted attrition:
- Predicting employee burnout with analytics
- Explainable AI in HR analytics
- Reducing employee turnover with burnout data
The governing principle throughout is human-in-the-loop: analytics surfaces risk for a person to review, never an automated judgement that triggers disciplinary action.
Privacy and governance
Governance is not a bolt-on; it is the precondition for workforce analytics being acceptable at all. Two pillars matter most. The first is data governance — collecting only metadata, retaining it for a defined period, being transparent with staff, and keeping the architecture audit-ready. The second is role-based access control (RBAC) — making sure that who can see what is enforced at the data layer, so a peer can never see a colleague's burnout score and an executive sees aggregates rather than individuals:
Data and deployment
Finally, the practical questions: where does the data come from, how is it kept fresh, and how do you stand the platform up. Microsoft Graph is the source for org structure, Planner tasks and calendar events. Deployment in regulated environments needs to respect data residency and network isolation, which is why an Azure Marketplace managed application — or an on-premises option — matters. These articles cover the data layer and the rollout:
- Microsoft Graph as a workforce data source
- Deploying workforce analytics on Azure Marketplace
- Workforce analytics implementation guide
How WorkforceIntelligence365 implements all of this
WorkforceIntelligence365 is Creodata Solutions' Azure cloud-first, metadata-driven workforce productivity and wellbeing platform. It puts the principles above into a single product. You can explore it on the product page or the external WorkforceIntelligence365 website.
Metadata only, via Microsoft Graph. WI365 ingests organisation structure from Azure AD, plans and tasks from Microsoft Planner, and meeting event metadata from Outlook and Teams calendars. It uses least-privilege Graph scopes (Directory, User, Group, Tasks and Calendars read access) and never requests permission to read mail or chat. It does not read email bodies, chat messages, recordings, document contents, keystrokes or screens — by design.
Incremental sync that stays fresh. A set of Azure Durable Functions runs on a timer (every 15 minutes in production), using delta queries and persisted delta tokens for incremental sync rather than full re-pulls. Upserts are idempotent, removed records are soft-deleted, and every run is recorded in a sync audit log. Retries respect Microsoft Graph throttling.
Weekly snapshots and configurable scoring. Productivity metrics — task completion, on-time delivery, weighted task output, meeting hours, focus hours and the meeting load index — are computed weekly into per-user snapshots. The composite productivity score is a weighted blend with a meeting-load penalty, and the weights are configurable per department so meeting-intensive functions are not unfairly penalised.
Explainable burnout, with ethics enforced. Burnout scoring runs weekly. The default model is a logistic regression computed in SQL, chosen for explainability and HR defensibility, with configurable, version-controlled coefficients; an Azure Machine Learning endpoint is an optional backend. Output is a probability and a risk level (Low / Moderate / High). Visibility is enforced: HR administrators see the probability, line managers see the factor breakdown rather than the raw number, executives do not see burnout at all, and scores are never exposed to peers. Human review is mandatory.
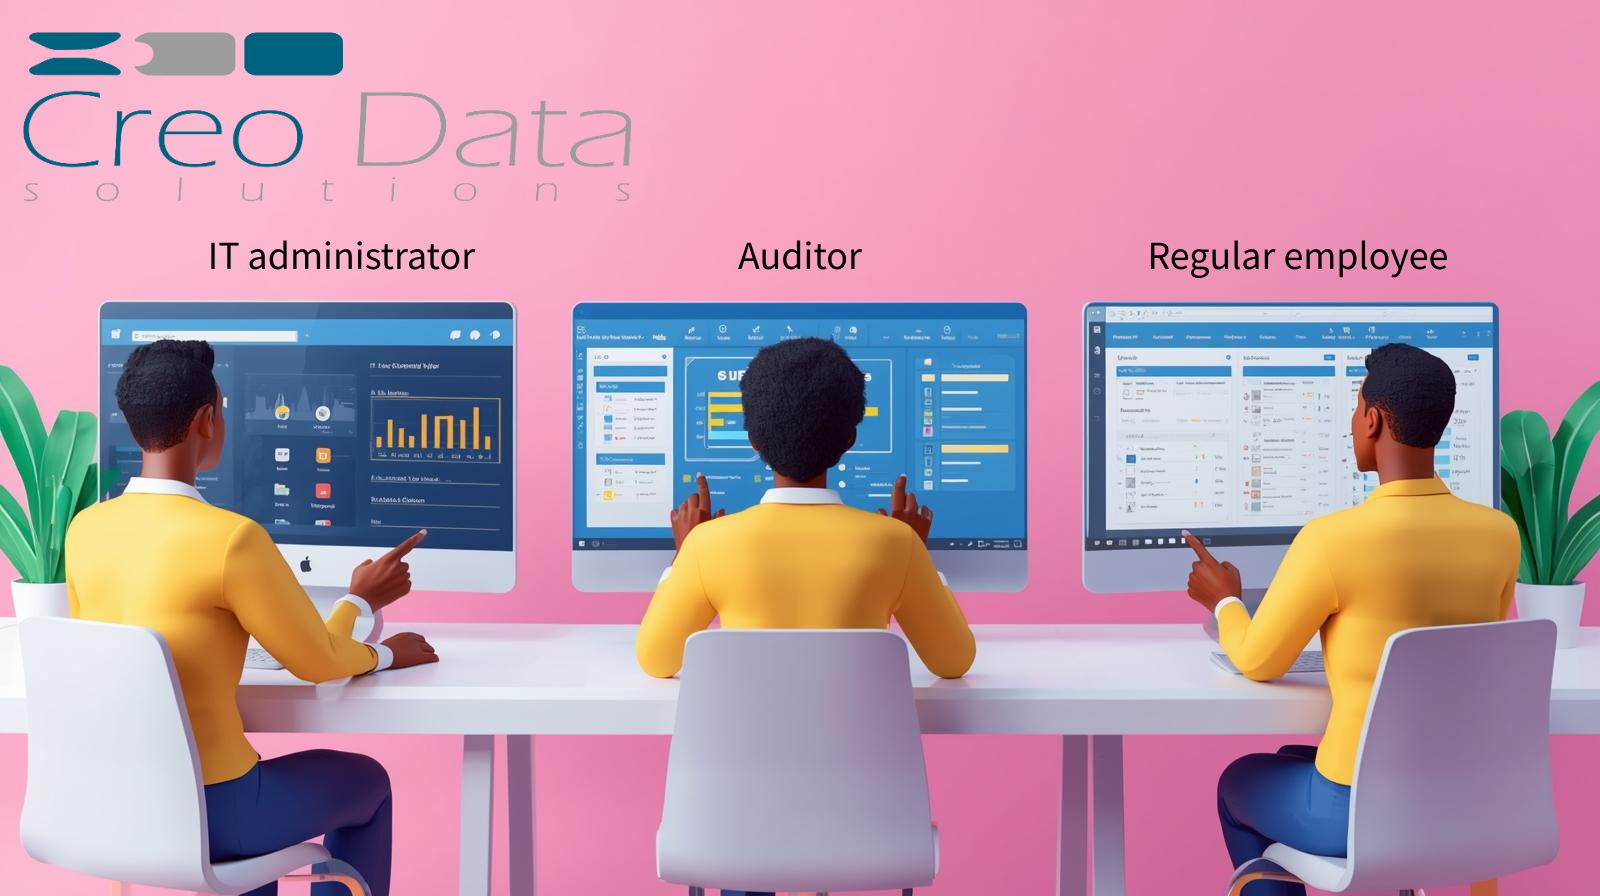
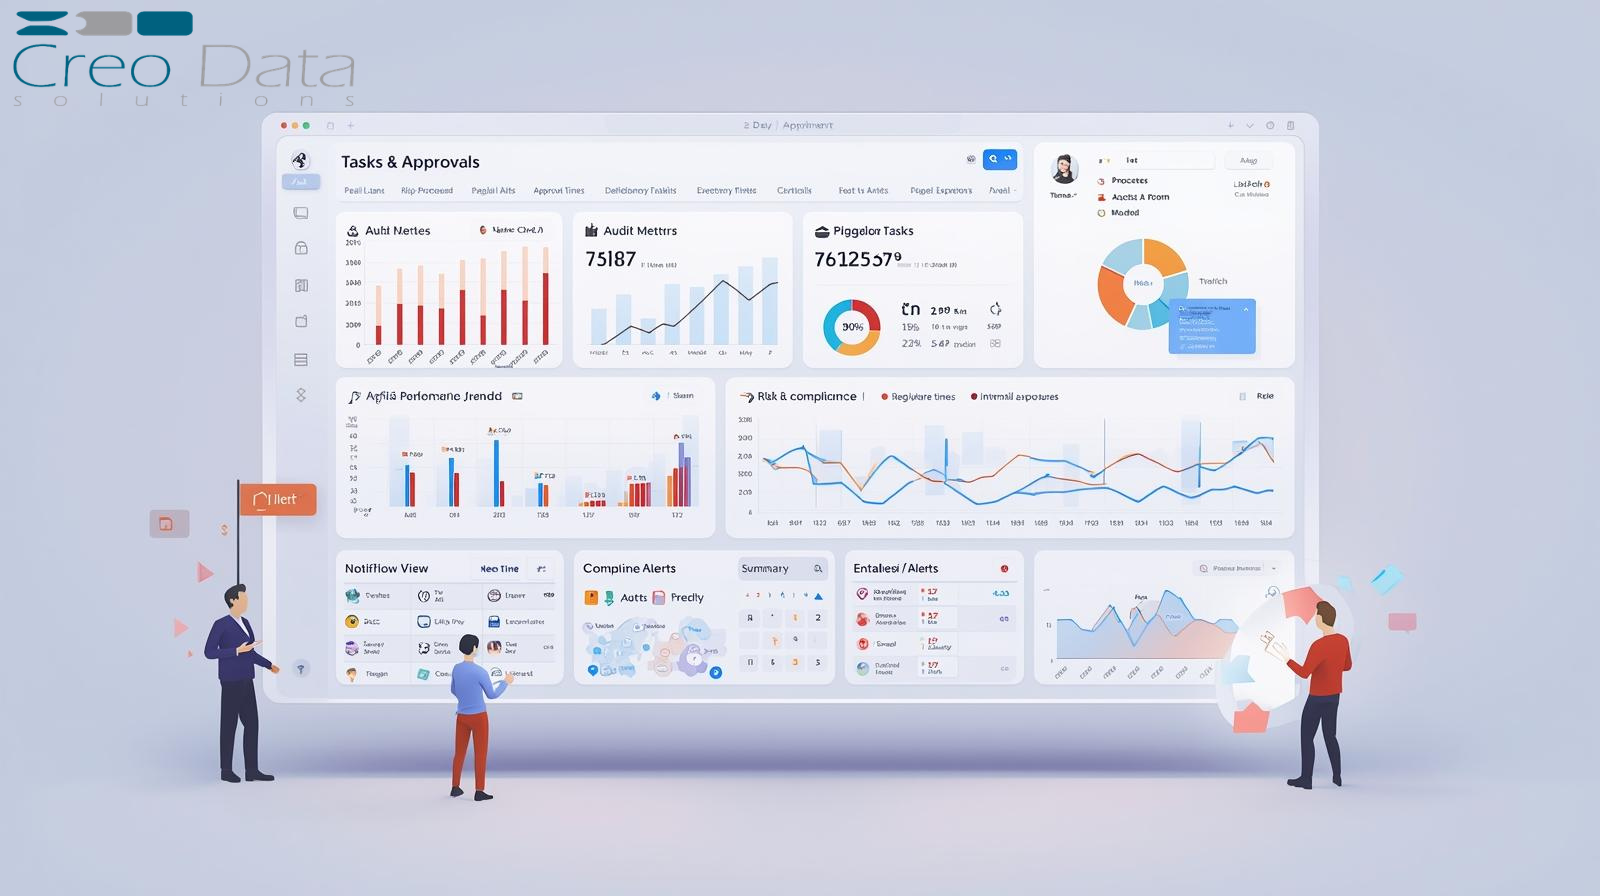
A role-scoped portal. The delivered interface is a Next.js portal with Azure AD single sign-on, dashboards for productivity, meetings, burnout and workload, an administration area for users, roles, KPI weights, scoring coefficients and audit logs, and CSV export. Five seeded roles — System Admin, HR Admin, Line Manager, Executive and Staff — govern what each user can see, enforced at the query level.
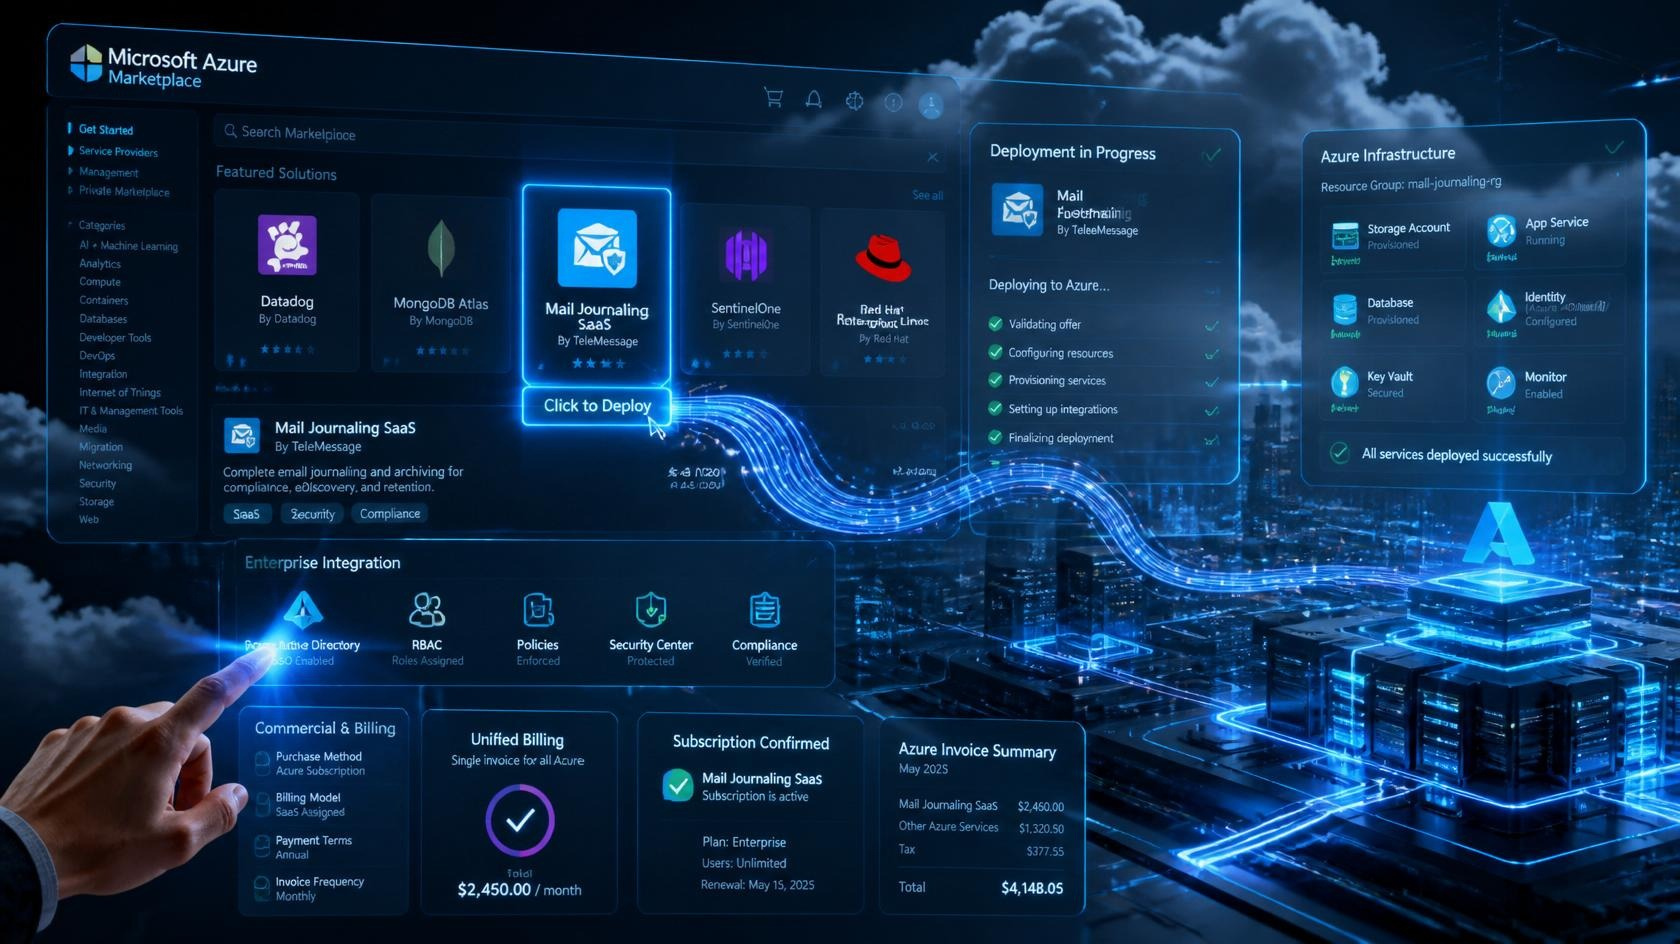
Azure managed application or on-premises. WI365 ships as an Azure Marketplace managed application deployed into the customer's own subscription, using PostgreSQL, Service Bus, Key Vault and private endpoints with zero-trust networking and managed identity. The same codebase also runs on-premises via Docker or Kubernetes. Billing is per active user through the Azure Marketplace metering API, across Starter, Pro and Enterprise tiers (USD), with on-premises Kubernetes licensing available. The platform is proven at enterprise scale — thousands of users across multiple tenants. For the wider Azure context, see Creodata's cloud solutions and the full product catalogue.
Frequently asked questions
Does workforce analytics read employees' emails or chat messages?
It should not, and WorkforceIntelligence365 does not. WI365 works exclusively from metadata: task records, calendar event timings, and organisation structure pulled through Microsoft Graph using least-privilege scopes. It never requests access to mail or chat, and it does not read message content, recordings, documents, keystrokes or screen activity. This metadata-only approach is what separates legitimate analytics from surveillance.
How is burnout risk calculated, and who can see it?
Burnout risk is scored weekly from workload signals such as overdue ratio, meeting hours, after-hours ratio, productivity trend and workload change. The default model is an explainable logistic regression with configurable coefficients, so the factors behind any score can be inspected and discussed. Visibility is role-scoped: HR administrators can see the probability, line managers see the contributing factors rather than the raw number, and executives and peers do not see individual burnout scores at all. Every assessment is reviewed by a person — there is no automated disciplinary action.
How does WorkforceIntelligence365 keep workforce data secure and compliant?
WI365 deploys as an Azure Marketplace managed application inside your own Azure subscription, with PostgreSQL behind private endpoints, secrets in Key Vault, managed identity and zero-trust networking, so there is no public database and the data stays in your environment. Access is governed by role-based controls enforced at the query layer, every change is captured in an audit log, and data retention is configurable. The architecture is designed for SOC 2 and GDPR-aligned controls and supports your DPIA; an on-premises deployment is available where data residency requires it.
What does WorkforceIntelligence365 cost?
WI365 uses per-user metered billing through the Azure Marketplace, with tiers for Starter (up to around 100 users), Pro (100-1,000) and Enterprise (1,000+), priced in USD, plus on-premises Kubernetes licensing for environments that cannot use the managed application. Because billing is metered on active, sync-enabled users and the tiers are configurable, pricing scales with actual usage. For a tailored quote, talk to our team.
See it on your own data
The fastest way to understand workforce analytics is to see it running against patterns you recognise. Book a demo and we will walk you through WorkforceIntelligence365 — from Microsoft Graph sync to explainable burnout scoring and the role-scoped portal — and show how a metadata-first approach delivers insight your people can trust.