
The Team That Looked Fine Until It Wasn't: Reading Burnout Risk From Calendars Alone
A consultancy lost three senior staff in one quarter. Calendar, Planner and org-chart metadata — not email content — showed the burnout signals months earlier.

Composite scenario drawn from typical East African deployments. Organisation details are anonymised and figures are representative rather than attributable to a single client.
Three resignations in eleven weeks
A professional services firm of about 280 people lost three senior consultants in a single quarter. All three were high performers. All three cited workload in their exit interviews. All three had told their line managers, in various ways, that they were struggling — and in each case the manager had understood it as a temporary crunch.
The managing partner's question afterwards was reasonable and hard to answer: could we have seen this coming?
The firm's HR data said no. Utilisation was within target. Leave balances were normal. Nobody had raised a formal grievance. On every metric the firm collected, the three departing consultants looked like everyone else.
What the firm was not measuring
The firm was measuring output. It was not measuring the conditions under which output was produced.
Two specific blind spots mattered.
Meeting load and focus time were invisible. Consultants were billing target hours, but for some of them those hours were fragmented across a calendar with no block longer than 45 minutes. Two of the three departures had, in their final six months, averaged more than 26 hours a week in scheduled meetings — leaving deep work to happen in evenings, where it does not appear in any system.
Workload distribution was assumed rather than checked. Project assignment happened at partner level, project by project. No one had a view of cumulative load across projects. One of the departing consultants was carrying active assignments on five engagements simultaneously; her line manager was aware of two of them.
The firm's initial instinct was to consider an activity-monitoring tool. It was rejected quickly, and correctly. A firm whose business is confidential client advice cannot deploy something that reads email content or logs keystrokes — the client obligations alone make it untenable, and the cultural damage would have exceeded any insight gained.
The approach taken
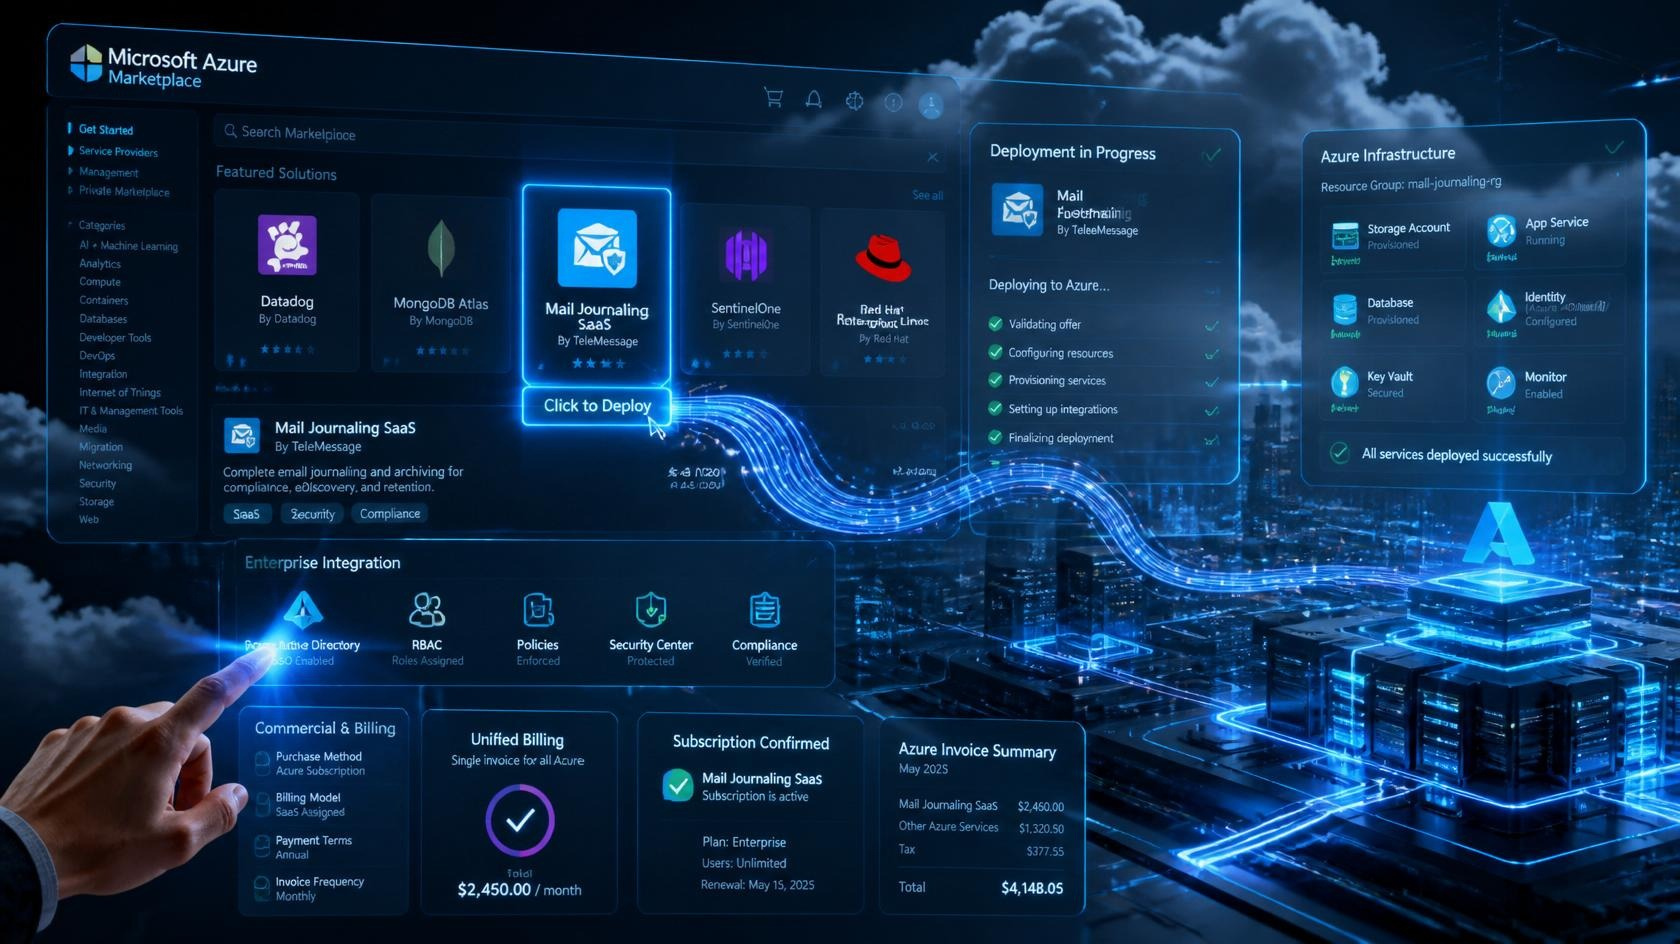
WorkforceIntelligence365 was deployed as an Azure Marketplace managed application within the firm's own subscription, syncing from Microsoft Graph.
The critical design point is what it looks at. Three metadata sources: calendar event timing, Planner task metadata, and the Azure AD organisational structure. It does not access email content, chat messages, documents or keystrokes. This was not a compromise the firm accepted; it was the reason the deployment was approved.
From those three sources the platform produces meeting load and focus-time analytics, workload distribution across assignments, productivity trends over a rolling twelve weeks, and an explainable burnout-risk indicator built on logistic regression.
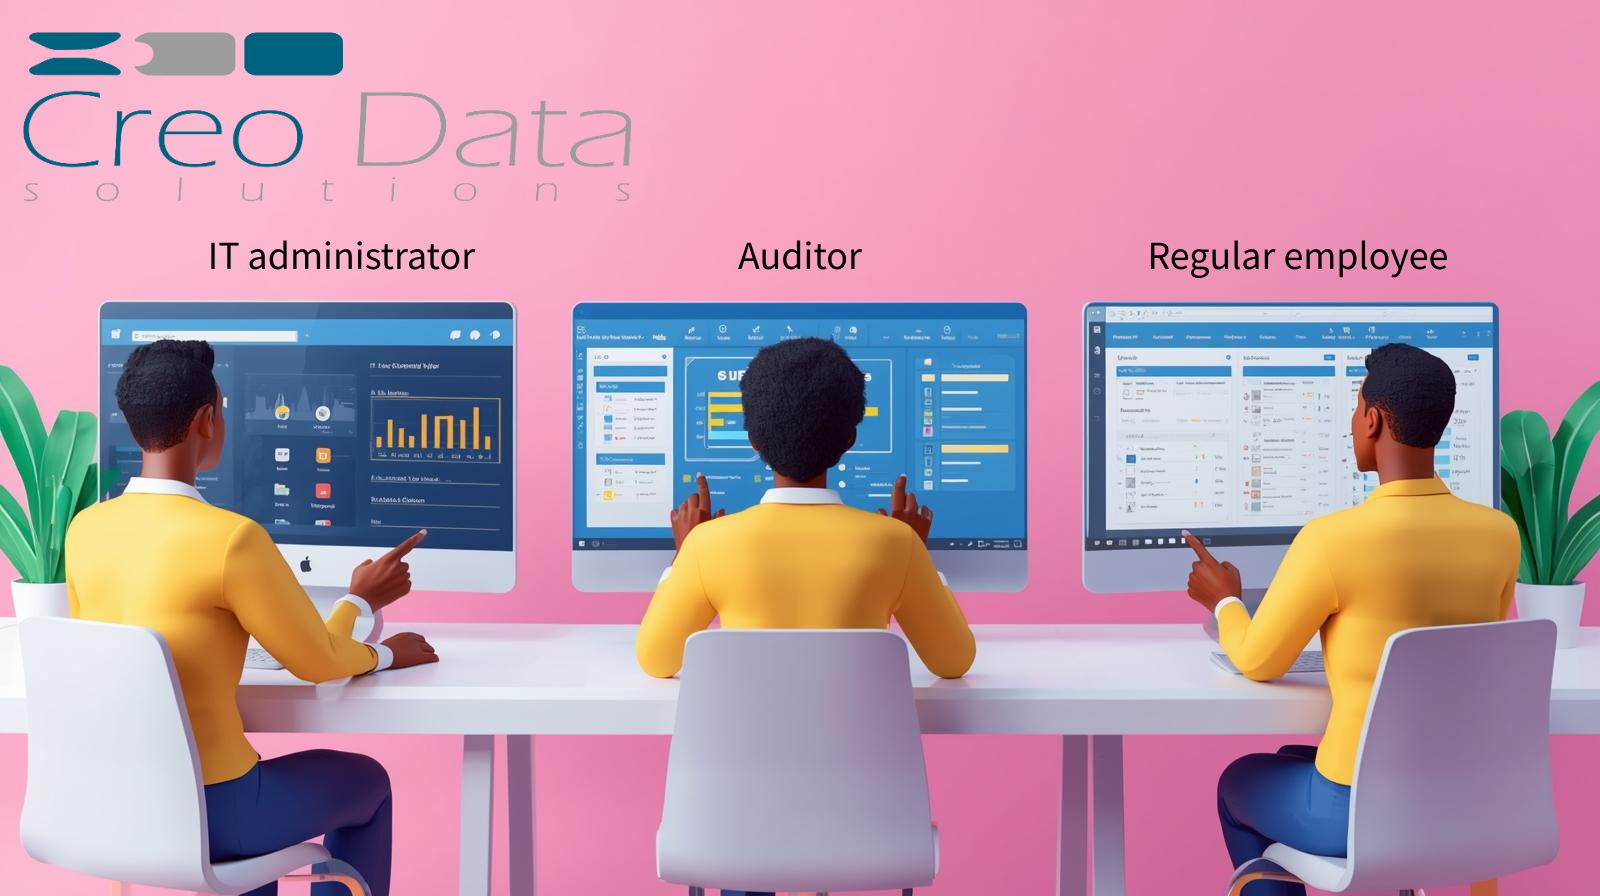
Access was configured to the platform's role model without modification: staff see only their own metrics; line managers see their direct reports; HR administrators see departmental views including burnout indicators; executives see aggregates only; system administrators see configuration and no data. A consultant cannot see a peer's numbers, and a partner cannot browse the firm.
Two governance rules were set before go-live. Burnout indicators are advisory and require human review — no automated action, no bearing on performance ratings or compensation. And the firm published, internally, exactly what data was being read and what was not, before anyone saw a dashboard.
What it surfaced
Within the first eight weeks the platform flagged eleven individuals as elevated risk. Four were people managers had already identified. Seven were not.
Of those seven, five had the same signature: high meeting load, fragmented focus time, and task assignments spread across more projects than their manager was aware of. The intervention in each case was mundane — reassignment, a declined recurring meeting, a project handed off — and none of it required a system to diagnose. It required someone to notice.
Aggregate reporting produced a second, structural finding. Meeting load was concentrated in the two grades immediately below partner, and much of it came from recurring meetings that had outlived their purpose. The firm cancelled or shortened a meaningful share of standing meetings across two departments and recovered measurable focus time without any change to staffing.
What to hold onto
Metadata is enough. Meeting timing, task assignment and reporting lines answer most of the questions organisations reach for content monitoring to answer. If a tool needs to read what people write, ask what it gives you that calendar and task data does not.
Publish the boundary before you deploy. Staff assume the worst about workforce analytics, usually with justification. Stating plainly what is read, what is not, and who can see what is the difference between a tool that gets used and one that gets resented.
Keep a human in the loop. A burnout indicator that triggers an automated action is a liability. One that prompts a manager to have a conversation is the point.
Further reading: The Complete Guide to Workforce Analytics with Microsoft 365 · Reducing Employee Turnover with Early Burnout Signals
Want visibility into workload without surveillance? Book a consultation or explore Workforce Intelligence to see exactly which Microsoft 365 signals it uses — and which it does not.